
Multicloud AI & ERP / AI-Ready Cloud Foundations & FinOps
Why it matters
Modern systems span dozens of services, managed platforms and AI calls. Without connected telemetry, every incident becomes a hunt across tools, and mean time to recovery grows with every new service.
How it works
Three signals, one story
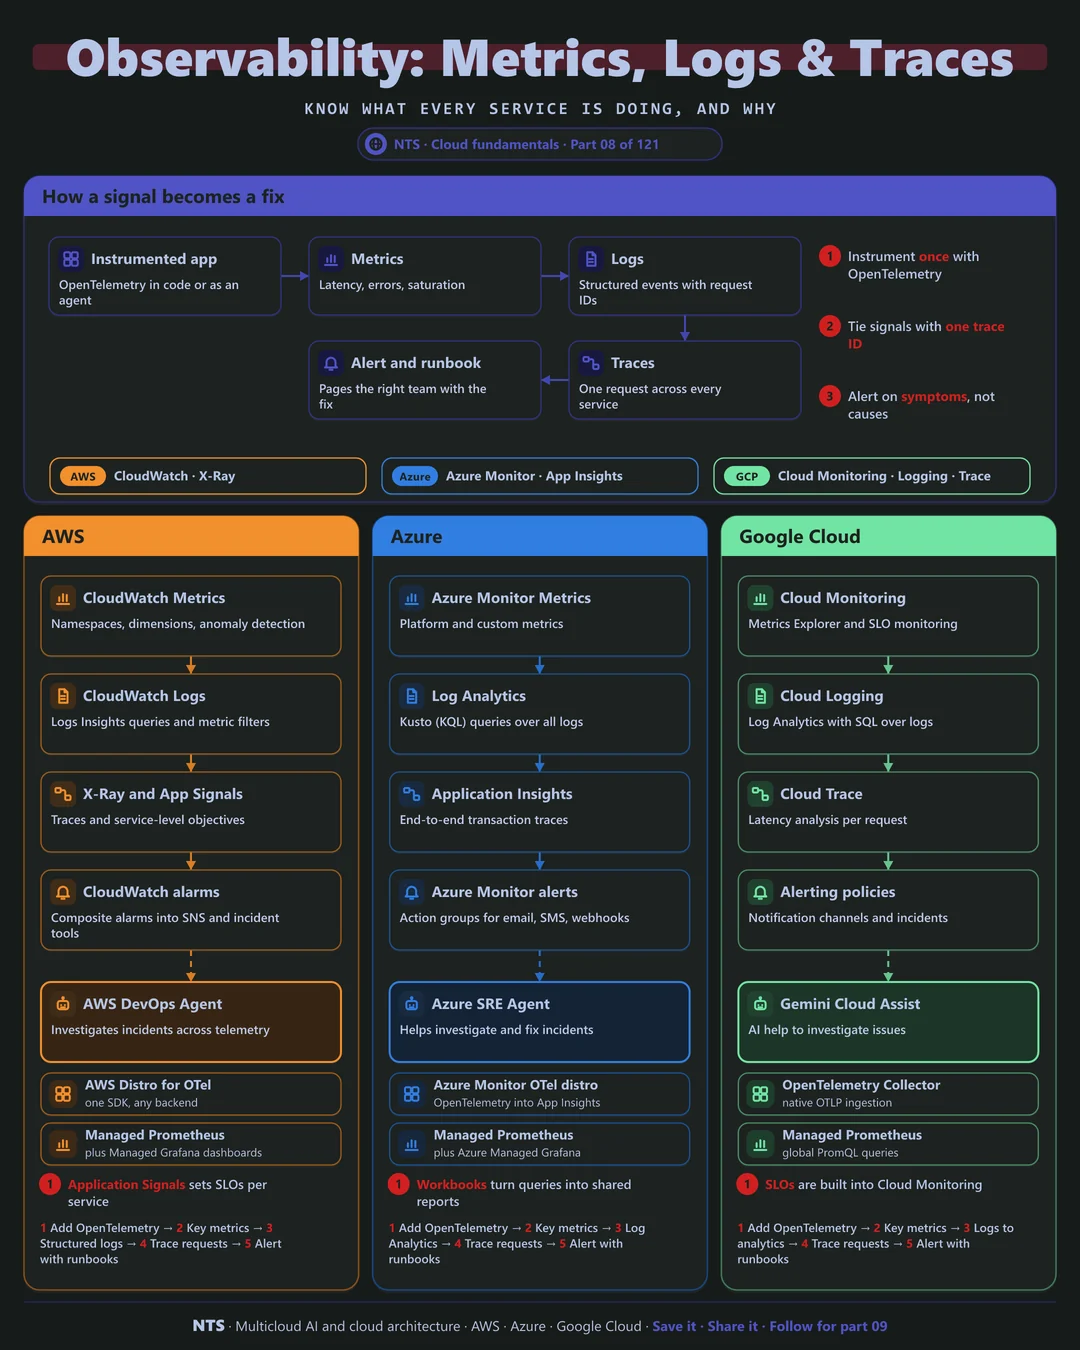
Metrics show the shape of the system: latency, error rates, saturation. Logs record structured events with context. Traces follow a single request across every service, showing where time is spent and where errors start. Linked by a shared trace ID, they let you move from an alert to the exact failing call in minutes.
Instrument once with OpenTelemetry
OpenTelemetry is the open standard for producing telemetry, and all three clouds accept it. Instrument code once and send data to any backend, or several, without rewriting the application. Alerts should fire on user-facing symptoms such as error rate and latency, and each should link to a runbook.
AWS, Azure and Google Cloud compared
| AWS | Azure | Google Cloud | |
|---|---|---|---|
| Metrics | CloudWatch Metrics | Azure Monitor Metrics | Cloud Monitoring |
| Logs | CloudWatch Logs Insights | Log Analytics (KQL) | Cloud Logging, Log Analytics (SQL) |
| Traces | X-Ray, Application Signals | Application Insights | Cloud Trace |
| Managed Prometheus | Amazon Managed Prometheus | Azure Monitor managed Prometheus | Managed Service for Prometheus |
| OpenTelemetry | AWS Distro for OpenTelemetry | Azure Monitor OpenTelemetry distro | Native OTLP ingestion |
| AI investigation | AWS DevOps Agent | Azure SRE Agent | Gemini Cloud Assist |
What makes each cloud different
AWS
CloudWatch covers metrics, logs and alarms, with Application Signals adding service-level objectives and dependency maps on top of OpenTelemetry. Managed Prometheus and Managed Grafana serve Kubernetes teams, and the AWS DevOps Agent helps investigate incidents across telemetry.
Azure
Azure Monitor centralizes data in Log Analytics, queried with the powerful Kusto Query Language. Application Insights provides end-to-end transaction views, Workbooks turn queries into shared reports, and the Azure SRE Agent assists with incident investigation.
Google Cloud
Google Cloud's operations suite brings Google's SRE heritage: SLO monitoring is built in, Cloud Logging's Log Analytics lets you query logs with SQL, and Managed Service for Prometheus offers global PromQL queries across clusters.
Design decisions that matter
- 01Standardize on OpenTelemetry
One instrumentation approach for every service and language.
- 02Propagate one trace ID everywhere
Including queues, functions and AI calls.
- 03Alert on symptoms
Page on user-facing error rate and latency, not on CPU.
- 04Define SLOs for key journeys
Use error budgets to balance speed and reliability.
- 05Control log costs
Sample, filter and tier logs by value.
Common mistakes we see
- Dashboards nobody watches. Build alerts and SLOs, not wall displays.
- Logging everything at debug. Costs explode while signal drowns in noise.
- Alerts without runbooks. On-call engineers lose time working out what to do.
- Separate tools per team. Incidents cross teams; telemetry must too.
A practical 30-day plan
- Week 1
Pick the top five user journeys and define SLOs.
- Week 2
Add OpenTelemetry to the services on those journeys.
- Week 3
Create symptom-based alerts with linked runbooks.
- Week 4
Tune log retention and sampling to cut cost.
How NTS helps
NTS designs observability platforms across AWS, Azure and Google Cloud: OpenTelemetry rollout, SLOs and alerting, log cost optimization and AI-assisted incident response. We help teams cut mean time to recovery and the size of their monitoring bill at the same time.
What you get
- OpenTelemetry instrumentation for key services
- Dashboards and SLOs for critical user journeys
- Alert rules tuned to symptoms, not noise
- Log retention and cost controls
Typical outcomes
- Faster detection and resolution of incidents
- Fewer noisy alerts and less on-call fatigue
- Predictable observability costs
How we work with you
- 1Assess
A focused review of your observability across AWS, Azure and Google Cloud. We look for the gaps we find most often: dashboards nobody watches, logging everything at debug, alerts without runbooks and separate tools per team.
- 2Design
A target architecture and roadmap built on the decisions that matter most: standardize on OpenTelemetry, propagate one trace ID everywhere, alert on symptoms, define SLOs for key journeys and control log costs.
- 3Build
Hands-on delivery alongside your team. We pick the top five user journeys and define SLOs, add OpenTelemetry to the services on those journeys, create symptom-based alerts with linked runbooks, and finally tune log retention and sampling to cut cost.
- 4Run and improve
We review SLOs, alert quality and telemetry costs regularly, and extend coverage as new services launch.
Why teams choose NTS for observability
- Signals that matter
We start with user journeys and SLOs, so alerts mean something when they fire.
- Open standards
OpenTelemetry keeps your telemetry portable across clouds and tools.
- Cost-aware telemetry
We sample, tier and retain data deliberately, so observability does not become your biggest bill.
Book a free 30-minute review
Talk to an NTS architect about your observability on AWS, Azure and Google Cloud.