
Multicloud AI & ERP / Cloud Data, Analytics & BI for AI
Why it matters
Fraud rings, recommendations, network dependencies and knowledge graphs are relationship problems that relational joins answer slowly. Sensor readings, metrics and prices are time problems that general databases store inefficiently. The right store turns minutes into milliseconds and cuts storage costs.
How it works
Graph databases
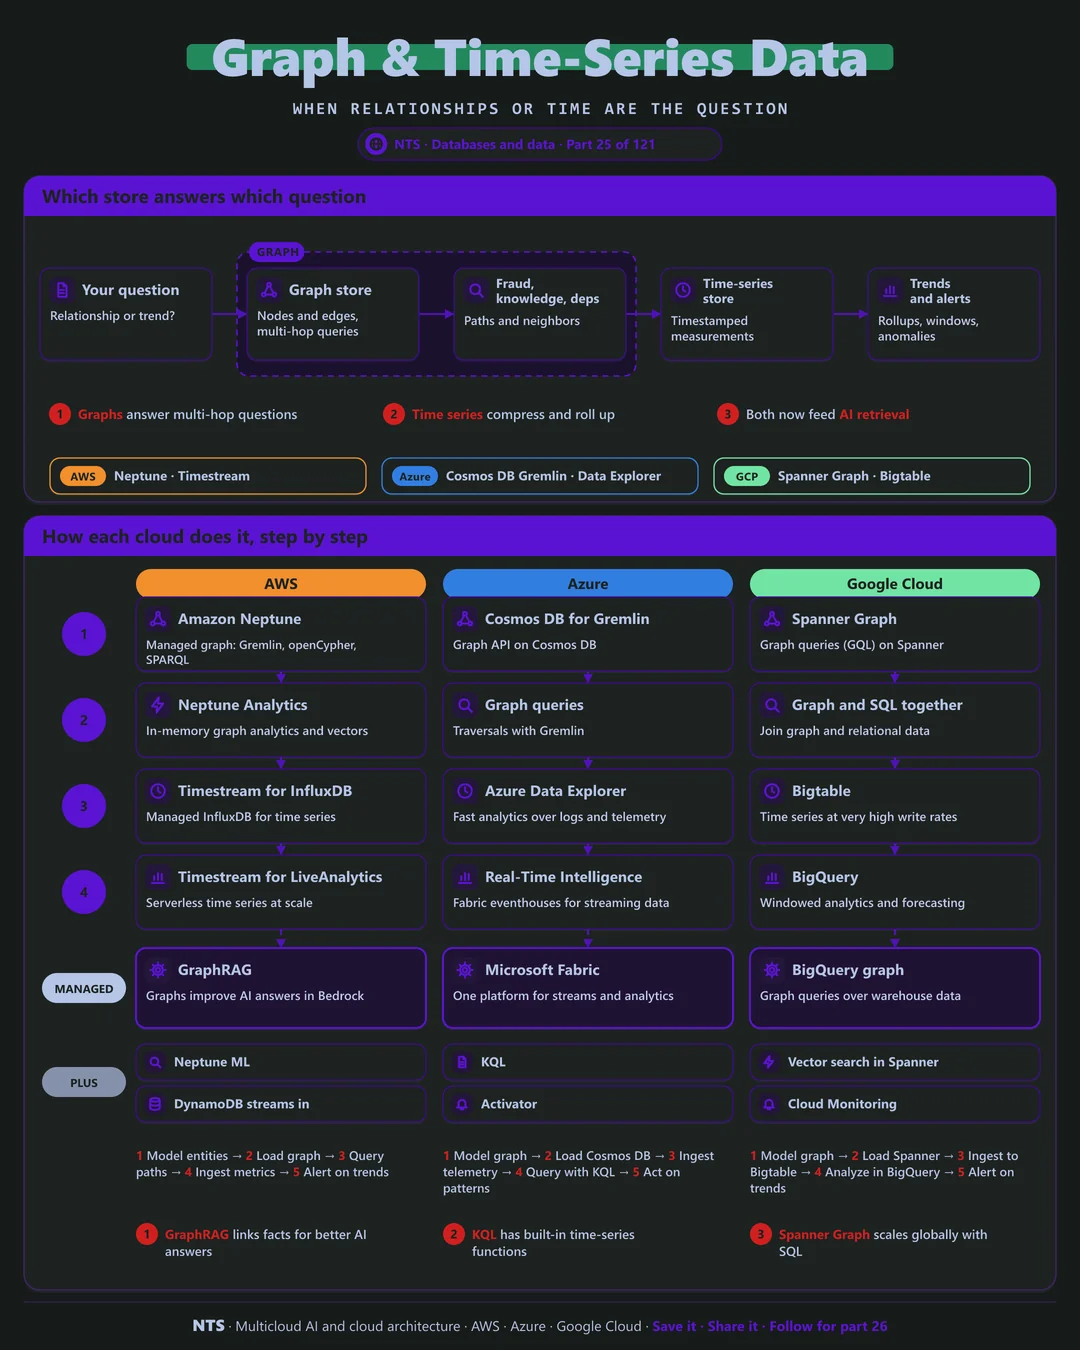
Graphs store nodes and edges directly, so multi-hop questions, such as "accounts within three transfers of a known fraudster", run quickly. Graphs are now also used to improve AI answers: GraphRAG links facts so models retrieve connected context, not isolated snippets.
Time-series stores
Time-series databases compress timestamped data heavily and provide functions for windows, rollups, forecasting and anomaly detection. Recent data stays fast; older data is downsampled to save cost.
AWS, Azure and Google Cloud compared
| AWS | Azure | Google Cloud | |
|---|---|---|---|
| Graph database | Amazon Neptune | Cosmos DB for Apache Gremlin | Spanner Graph |
| Graph analytics | Neptune Analytics | Fabric with graph tools | BigQuery graph queries |
| Time-series store | Timestream for InfluxDB, LiveAnalytics | Azure Data Explorer | Bigtable |
| Streaming analytics | Managed Flink | Fabric Real-Time Intelligence | Dataflow, BigQuery |
| Query language | Gremlin, openCypher, SPARQL | Gremlin, KQL | GQL, SQL |
What makes each cloud different
AWS
Amazon Neptune supports Gremlin, openCypher and SPARQL, and Neptune Analytics runs in-memory graph algorithms and vector search together, a strong fit for GraphRAG with Bedrock. Timestream offers managed InfluxDB and a serverless time-series engine.
Azure
Azure's strength is time and telemetry: Azure Data Explorer and Fabric eventhouses query huge volumes with KQL, which has built-in time-series, anomaly and forecasting functions. Graph workloads run on Cosmos DB for Gremlin.
Google Cloud
Spanner Graph brings graph queries (GQL) to Spanner, so graph and relational data live in one globally consistent database. Bigtable handles time series at very high write rates, and BigQuery adds windowed analytics and forecasting.
Design decisions that matter
- 01Use graphs when relationships are the question
Multi-hop queries are the signal.
- 02Downsample old time-series data
Keep detail where it is useful, rollups elsewhere.
- 03Consider GraphRAG for AI
Connected context improves answer quality.
- 04Keep one source of truth
Feed specialized stores from events, not manual copies.
Common mistakes we see
- Graphs for simple lookups. Adds complexity with no benefit.
- Raw sensor data kept forever. Storage grows without adding insight.
- Separate copies with no sync. Graph and source data drift apart.
A practical 30-day plan
- Week 1
Identify relationship-heavy and time-heavy use cases.
- Week 2
Prototype one in the purpose-built store.
- Week 3
Feed it from change streams or event pipelines.
- Week 4
Set retention and downsampling, and measure the gains.
How NTS helps
NTS builds graph and time-series solutions on AWS, Azure and Google Cloud, from fraud and network analytics to IoT telemetry and GraphRAG for better AI answers.
What you get
- A fit check for graph and time-series databases
- Data models and queries for your use cases
- Ingestion pipelines for events and metrics
- Retention and downsampling policies
Typical outcomes
- Fast queries on relationships and time ranges
- Insight from fraud, network or IoT data
- Predictable storage costs
How we work with you
- 1Assess
A focused review of your graph and time-series data across AWS, Azure and Google Cloud. We look for the gaps we find most often: graphs for simple lookups, raw sensor data kept forever and separate copies with no sync.
- 2Design
A target architecture and roadmap built on the decisions that matter most: use graphs when relationships are the question, downsample old time-series data, consider GraphRAG for AI and keep one source of truth.
- 3Build
Hands-on delivery alongside your team. We identify relationship-heavy and time-heavy use cases, prototype one in the purpose-built store, feed it from change streams or event pipelines, and finally set retention and downsampling, and measure the gains.
- 4Run and improve
We tune queries, retention and capacity as data volumes grow.
Why teams choose NTS for graph and time-series data
- The right tool for connected data
We use graph and time-series databases only where they beat relational options.
- Production-ready ingestion
We build pipelines that handle high event volumes reliably.
- Cost-smart retention
Downsampling keeps history useful without endless storage growth.
Book a free 30-minute review
Talk to an NTS architect about your graph and time-series data on AWS, Azure and Google Cloud.