
Multicloud AI & ERP / Cloud Data, Analytics & BI for AI
Why it matters
Conflicting numbers from different reports destroy trust. A single definition of every metric, with natural-language access, lets people answer their own questions and stop arguing about whose spreadsheet is right.
How it works
From question to trusted answer
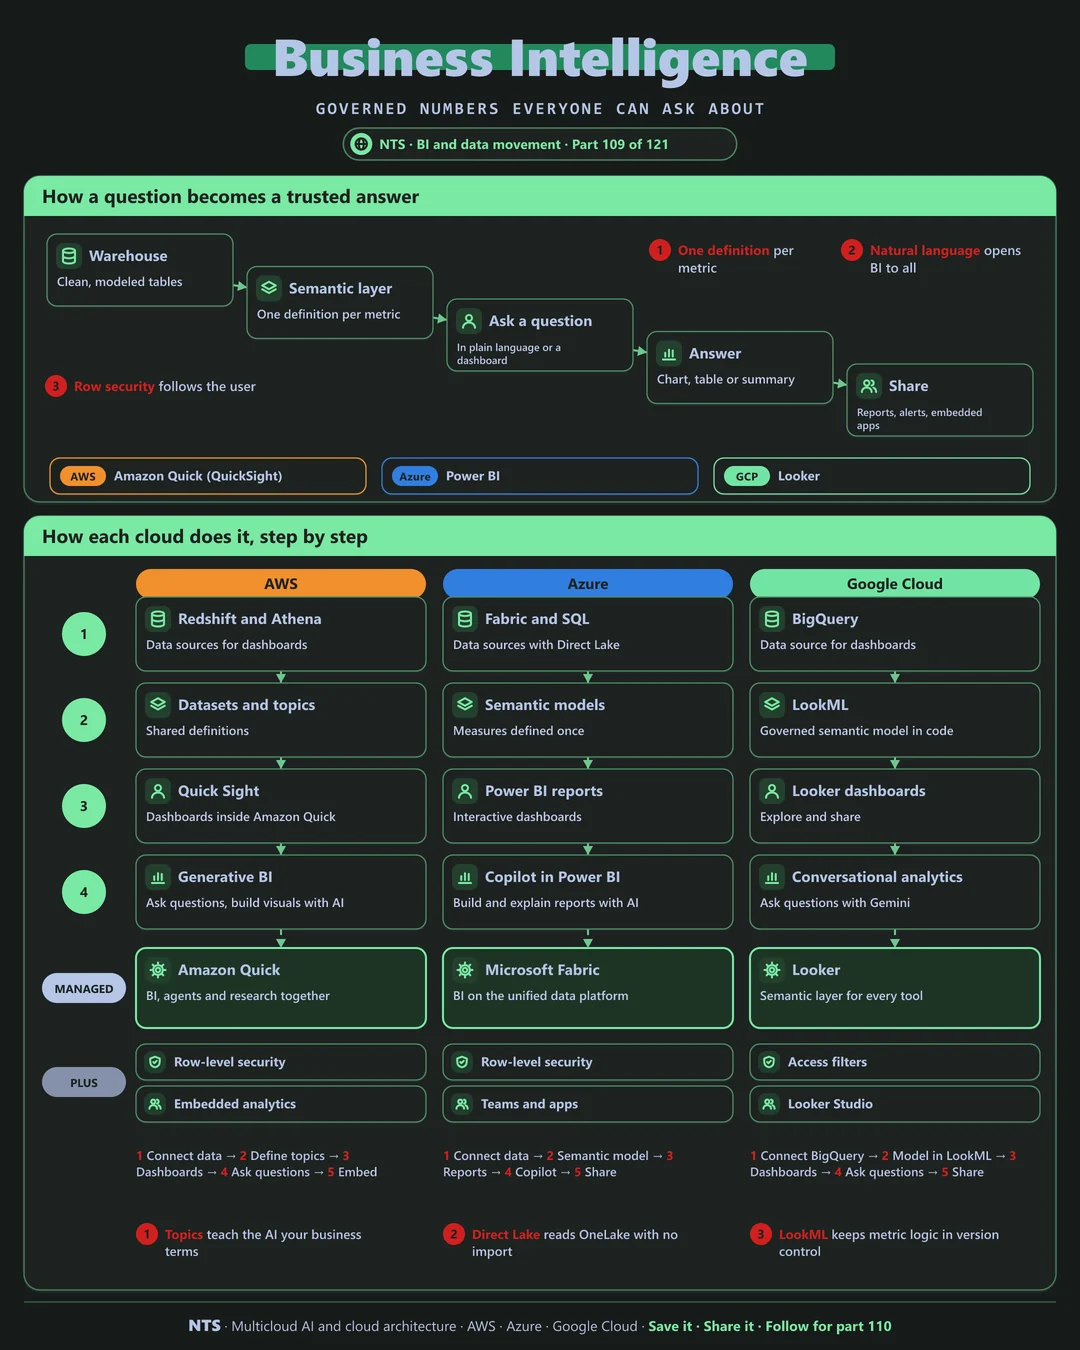
Clean data sits in a warehouse. A semantic layer defines each metric once. People ask questions in plain language or through dashboards, get a chart or summary and share it in reports, alerts or embedded apps, with row-level security following each user.
AWS, Azure and Google Cloud compared
| AWS | Azure | Google Cloud | |
|---|---|---|---|
| BI tool | Amazon Quick (QuickSight) | Power BI | Looker |
| Semantic layer | Datasets and topics | Semantic models | LookML |
| Natural-language questions | Generative BI in Quick | Copilot in Power BI | Conversational analytics with Gemini |
| Row-level security | Row-level security | Row-level security, labels | Access filters |
| Embedded analytics | Embedded dashboards | Power BI Embedded | Looker embedding |
What makes each cloud different
AWS
Amazon QuickSight, now part of Amazon Quick, offers dashboards and generative BI where topics teach the AI your business terms, plus embedded analytics for your own apps.
Azure
Power BI is the most widely used enterprise BI tool, with semantic models, Copilot for building and explaining reports and Direct Lake access to OneLake in Fabric.
Google Cloud
Looker keeps metric logic in LookML, version-controlled like code, and serves governed data to dashboards, spreadsheets and Gemini-powered conversational analytics.
Design decisions that matter
- 01Define each metric once
In the semantic layer.
- 02Natural language on governed data
Not on raw tables.
- 03Security follows the user
Row-level rules everywhere.
- 04Retire duplicate reports
One version of the truth.
Common mistakes we see
- Metrics defined in every dashboard. Different answers to the same question.
- AI over ungoverned tables. Confident but wrong answers.
- Too many dashboards. Nobody knows which one to trust.
A practical 30-day plan
- Week 1
List the top 20 business metrics and owners.
- Week 2
Define them in the semantic layer.
- Week 3
Rebuild key dashboards on the definitions.
- Week 4
Turn on natural-language questions for a pilot group.
How NTS helps
NTS builds governed BI with Amazon Quick, Power BI and Looker, covering semantic models, migration from legacy tools, natural-language analytics and dashboard rationalization.
What you get
- A BI platform on Quick Suite, Power BI or Looker
- A semantic layer with trusted metrics
- Executive and team dashboards
- Natural language questions for business users
Typical outcomes
- Faster, trusted decisions
- Fewer conflicting reports
- Less dependence on analysts for every question
How we work with you
- 1Assess
A focused review of your business intelligence across AWS, Azure and Google Cloud. We look for the gaps we find most often: metrics defined in every dashboard, AI over ungoverned tables and too many dashboards.
- 2Design
A target architecture and roadmap built on the decisions that matter most: define each metric once, natural language on governed data, security follows the user and retire duplicate reports.
- 3Build
Hands-on delivery alongside your team. We list the top 20 business metrics and owners, define them in the semantic layer, rebuild key dashboards on the definitions, and finally turn on natural-language questions for a pilot group.
- 4Run and improve
We maintain metrics, add data sources and improve dashboards with user feedback.
Why teams choose NTS for business intelligence
- One version of the truth
Shared metrics end arguments about numbers.
- Self-service done safely
Business users explore data within guardrails.
- AI-powered insights
People ask questions in plain language.
Book a free 30-minute review
Talk to an NTS architect about your business intelligence on AWS, Azure and Google Cloud.