
Multicloud AI & ERP / Cloud Migration, Integration & AI Operations
Why it matters
Sustainability reporting rules such as the EU CSRD and customer expectations make IT emissions visible. Usefully, the actions that cut cloud carbon usually cut cost too.
How it works
Reducing cloud carbon
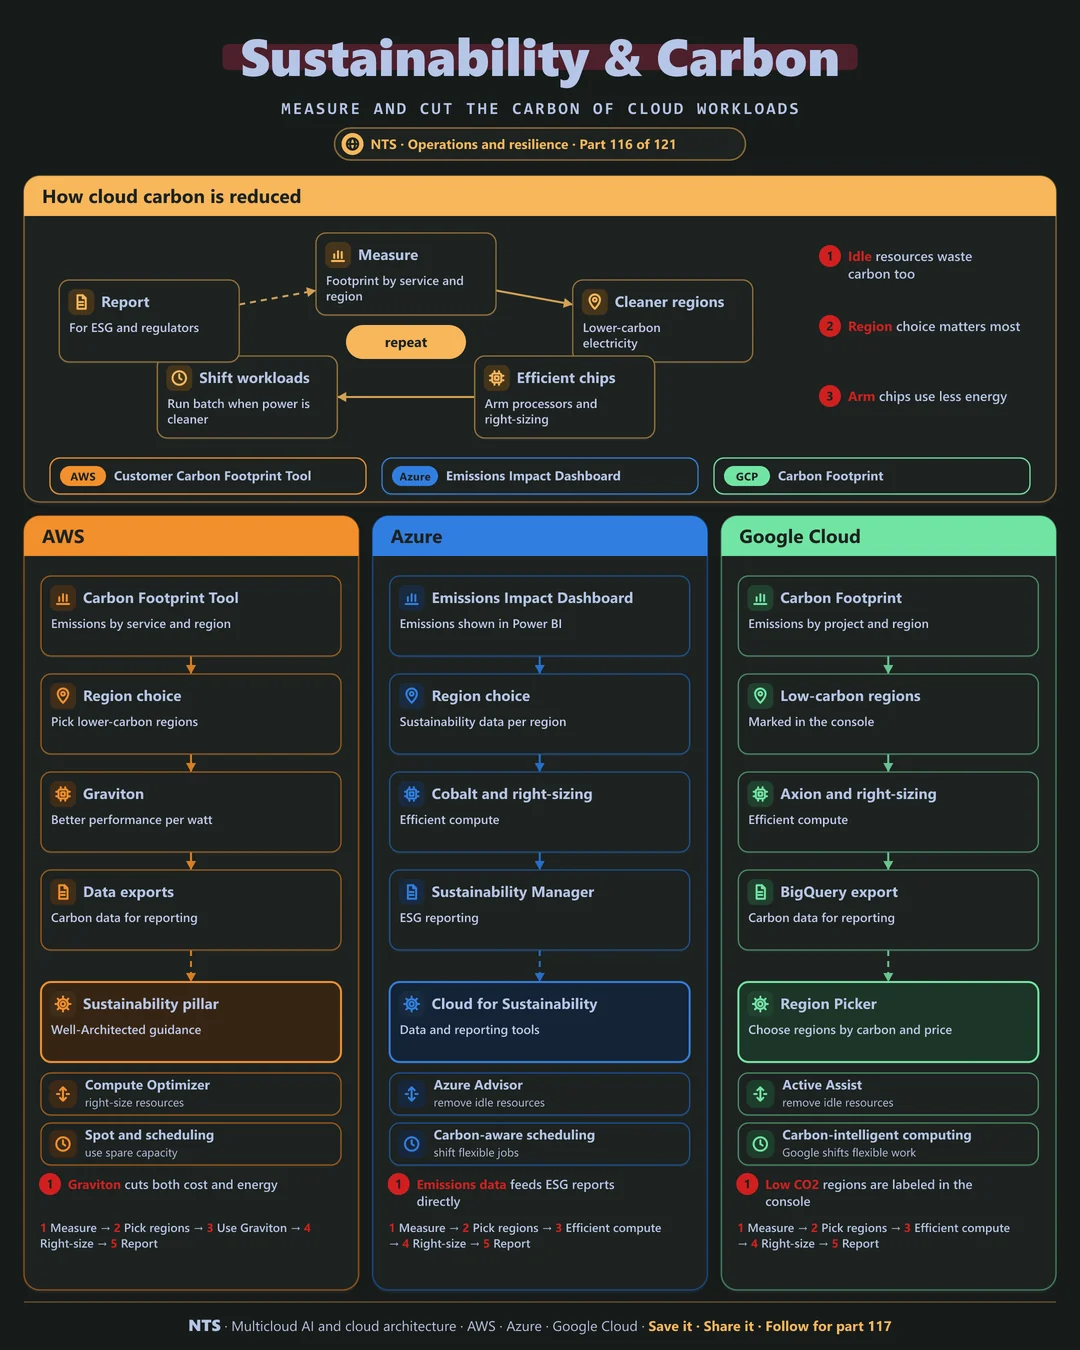
Measure emissions by service and region. Prefer cleaner regions with lower-carbon electricity, use efficient chips such as Arm processors and right-size resources, shift flexible workloads to cleaner times and report results for ESG disclosures.
AWS, Azure and Google Cloud compared
| AWS | Azure | Google Cloud | |
|---|---|---|---|
| Footprint tool | Customer Carbon Footprint Tool | Emissions Impact Dashboard | Carbon Footprint |
| Data export | Data Exports | Power BI, Sustainability Manager | BigQuery export |
| Efficient compute | Graviton | Cobalt | Axion |
| Region guidance | Sustainability pillar guidance | Region sustainability data | Low CO2 region labels, Region Picker |
| Idle resource cleanup | Compute Optimizer | Azure Advisor | Active Assist |
What makes each cloud different
AWS
AWS's Customer Carbon Footprint Tool reports emissions by service and region, the Well-Architected sustainability pillar guides design and Graviton processors deliver better performance per watt.
Azure
Microsoft's Emissions Impact Dashboard shows cloud emissions in Power BI, and Microsoft Sustainability Manager brings that data into wider ESG reporting.
Google Cloud
Google Cloud's Carbon Footprint reports emissions by project and region, labels low-carbon regions in the console and offers a Region Picker that weighs carbon, price and latency.
Design decisions that matter
- 01Measure before optimizing
Baseline by service and region.
- 02Remove idle resources
The easiest carbon and cost win.
- 03Prefer cleaner regions for new work
Where latency and residency allow.
- 04Report alongside cost
One FinOps and GreenOps view.
Common mistakes we see
- Reporting without acting. Numbers unchanged year on year.
- Ignoring idle resources. Waste in both cost and carbon.
- Treating it as separate from FinOps. The same levers drive both.
A practical 30-day plan
- Week 1
Export footprint data for all accounts.
- Week 2
Remove idle and oversized resources.
- Week 3
Move suitable workloads to Arm and cleaner regions.
- Week 4
Publish a combined cost and carbon report.
How NTS helps
NTS combines FinOps and GreenOps on AWS, Azure and Google Cloud, covering footprint reporting, efficiency improvements, region strategy and ESG-ready reporting.
What you get
- Carbon footprint reporting across clouds
- Idle resource cleanup
- Efficiency improvements with Arm chips and right-sizing
- ESG-ready cost and carbon reports
Typical outcomes
- Lower cloud emissions
- Lower cloud costs
- Data ready for ESG and CSRD reporting
How we work with you
- 1Assess
A focused review of your cloud sustainability across AWS, Azure and Google Cloud. We look for the gaps we find most often: reporting without acting, ignoring idle resources and treating it as separate from FinOps.
- 2Design
A target architecture and roadmap built on the decisions that matter most: measure before optimizing, remove idle resources, prefer cleaner regions for new work and report alongside cost.
- 3Build
Hands-on delivery alongside your team. We export footprint data for all accounts, remove idle and oversized resources, move suitable workloads to Arm and cleaner regions, and finally publish a combined cost and carbon report.
- 4Run and improve
We track emissions and costs each quarter and find the next reductions.
Why teams choose NTS for cloud sustainability
- Green and lean together
Our actions cut carbon and cost at the same time.
- Reporting made simple
We combine data from all three clouds into one view.
- Practical steps
We focus on changes that move the numbers.
Book a free 30-minute review
Talk to an NTS architect about your cloud sustainability on AWS, Azure and Google Cloud.